PSS/E / Load Modeling / Data Centers
Replaying Data-Center Load Profiles in PSS/E with LPB1BL

Javi Rosa
Large data-center connections are making time-varying demand profiles increasingly relevant to transmission planning and dynamic studies. Siemens has also highlighted data centers and other large loads among the scenarios driving new grid-planning needs. Siemens, May 5, 2026.
With PSS/E 36.7, released in September 2026, Siemens added the built-in LPBKBL1U load-playback model. It reads an .LPB file and applies its active-power and reactive-power time series to a load. This is a useful addition, but it is available only to users on PSS/E 36.7 or later. Teams still running PSS/E 34, 35, or earlier 36 releases cannot use that built-in model.
Get LPB1BL
An independent playback model for earlier PSS/E releases
We developed LPB1BL as an independent PSS/E load model for playback of active and reactive demand from an .LPB table. It is designed for users who need this workflow on older PSS/E releases. Version-specific libraries are provided for PSS/E 33, 34, 35, and 36.
LPB1BL is our own implementation. It is not a Siemens product and is not affiliated with, endorsed by, or commercially connected to Siemens. The goal is to make a practical load-playback tool available to power-system engineers working across different PSS/E versions.
What the model does
An .LPB file contains three values per row:
time_s, P_MW, Q_MvarValues may be separated by commas, spaces, or a combination of both. LPB1BL linearly interpolates between time points and holds the last value after the final row. Before the first table timestamp, it leaves the standard PSS/E load unchanged, which allows a flat start before playback begins.
Active and reactive playback can be enabled or disabled independently. Each component also has its own optional first-order low-pass filter, controlled by the Tfp and Tfq time constants. With both filters bypassed, the load follows the input profile directly.
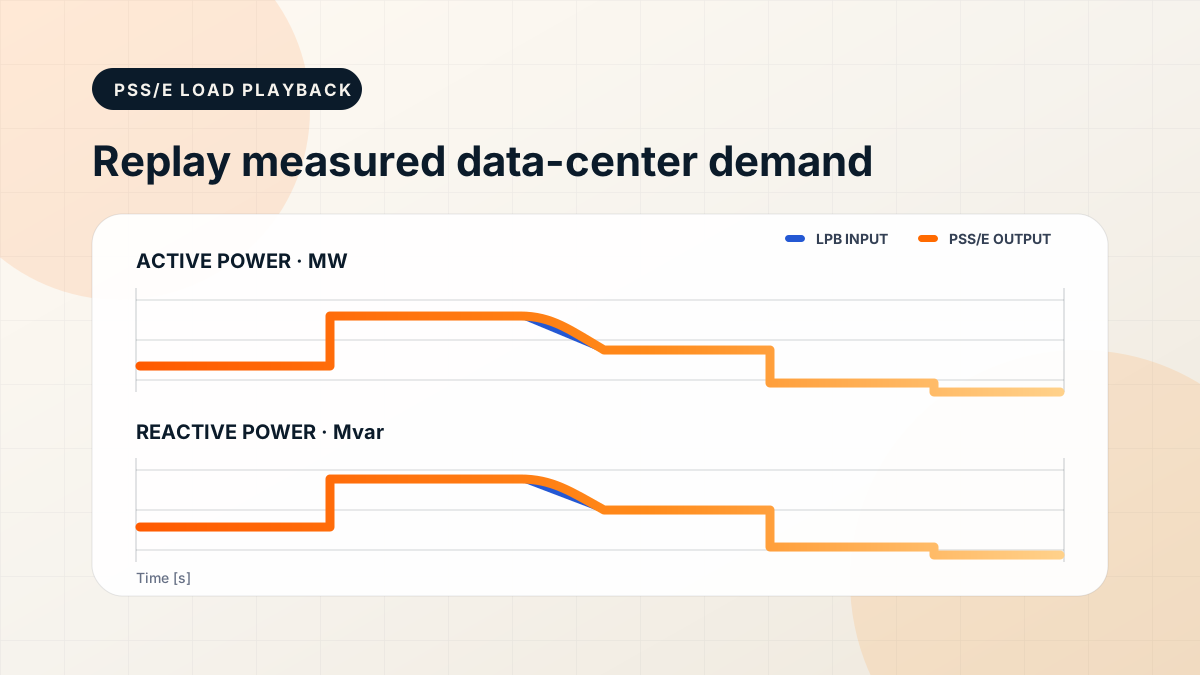
This makes it possible to take measured P and Q from a data-center site and replay that demand on a transmission-network model. Engineers can study how the measured load behavior interacts with the surrounding grid without coupling the site measurement system to the power-system simulation in real time.
Validation against Siemens LPBKBL1U
We tested LPB1BL and Siemens’ LPBKBL1U in PSS/E 36.7.1 using the same three-bus case, .LPB table, event profiles, and 1 ms simulation step. Each run produced 10,003 samples over approximately 10 seconds.
The test events included voltage steps and changes in both the active-power (P) and reactive-power (Q) playback profiles. We evaluated the playback with LPB1BL’s low-pass filters disabled and enabled. With filtering disabled, both models followed the P and Q profiles within the defined tolerances, including during the voltage steps. In a representative run, the maximum differences were 1.9e-7 MW in P, 9.4e-8 Mvar in Q, and 6e-8 pu at bus 1.
When LPB1BL‘s Tfp/Tfq low-pass filters are enabled, its P and Q responses show smoother transients than Siemens’ built-in LPBKBL1U, which has no equivalent filtering parameters. The different response is expected when comparing filtered playback with an unfiltered model; it reflects their different filtering capabilities, not a failure to read the .LPB file.
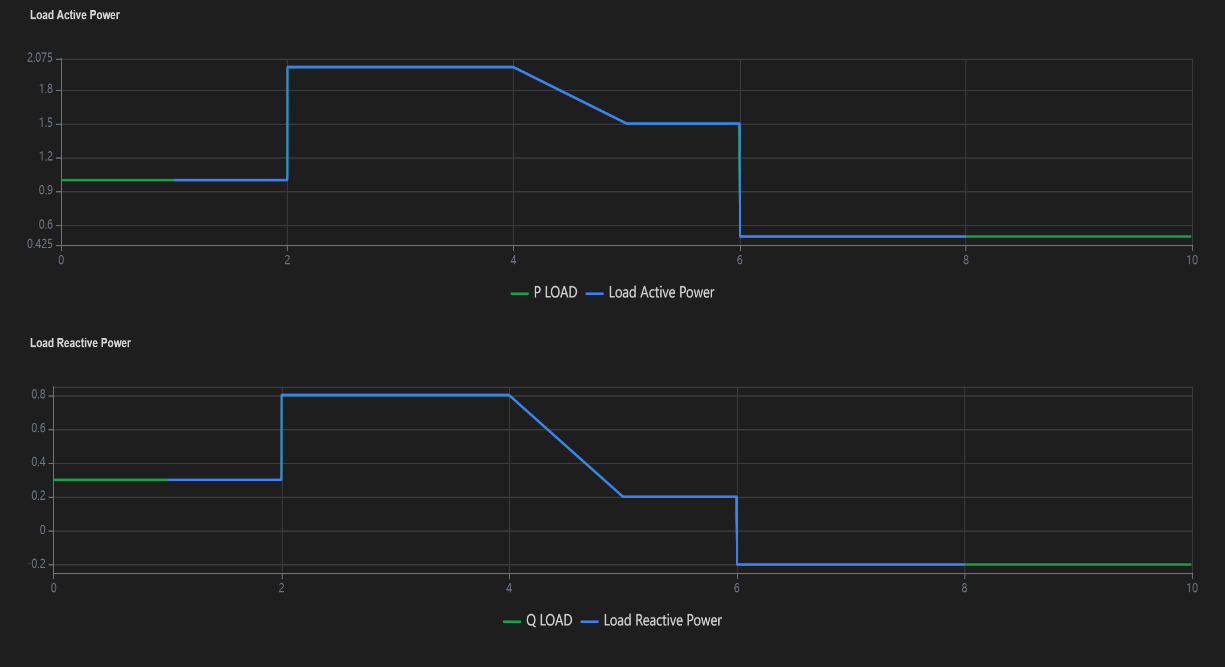
The release package includes the test case, exported simulation data, comparison report, and plots. The static ESPlotter export below shows the LPB1BL input and simulated output traces for P and Q. With the filters bypassed, the P input aligns with the simulated P trace, and the same is true for Q.
Source and package
The source code is available in the public ESPlotter GitHub repository under the MIT License, which permits reuse, modification, and redistribution under its terms. If you want to add a feature or improve the model, you can work in a fork and submit a pull request through GitHub. We welcome contributions that make the model useful for more study needs.
Download the complete model and validation package: Get the ZIP
The repository includes the Fortran implementation and versioned model libraries.
Open the profile and simulation results in ESPlotter
Load the .LPB input profile and the PSS/E .out results in ESPlotter to inspect the profile data alongside the simulated active- and reactive-power traces.
ESPlotter with the LPB input profile and PSS/E output open alongside the P and Q traces
If you need a way to visualize LPB1BL simulation results, download ESPlotter for Windows to open PSS/E .out files and inspect the simulated P and Q traces alongside the input profile.