TSAT / SSAT / Eigenvalues
How to Open TSAT and SSAT .bin Files and Plot SSAT Eigenvalues

Javi Rosa
TSAT and SSAT, part of the DSATools suite, store their results in .bin files. A single study can contain many scenarios and contingencies, and reviewing them usually means navigating the results inside the tool, exporting intermediate files, or writing custom scripts.
This guide shows how to open those .bin files directly in ESPlotter, compare results across scenarios and contingencies, and plot SSAT eigenvalues in the complex plane.
Requirements
ESPlotter reads .bin files through the result reader installed with TSAT or SSAT, so you need:
- Windows.
- TSAT or SSAT installed on the same computer, with its result reader component registered by the installation.
ESPlotter is not commercially affiliated with DSATools. If the corresponding installation is not available, ESPlotter shows an error asking you to verify that the software is installed on that computer.
Two kinds of results in one extension
A .bin file can contain different result families:
- TSAT
.binfiles contain time-series channels. - SSAT
.binfiles contain either time-series channels or eigenvalues.
You do not have to choose an import mode. ESPlotter detects the result family when you open the file and uses the matching workflow: time-series results open as normal channel files for Time Series charts, while eigenvalue results open as an eigenvalue channel file for Eigenvalues charts.
Open the file
- Use File > Open File, or drag the
.binfile into the chart workspace. - ESPlotter organizes the available results by scenario and contingency.
- Add the channels you need to a chart.
If some scenarios or contingencies in the file do not provide usable data, ESPlotter still opens the rest and shows one persistent warning listing the skipped entries. You keep the usable results without missing that part of the study is incomplete.
Time-series results
TSAT time-series results use the same chart workflow as every other format in ESPlotter. That means you can:
- Compare contingencies on the same chart, for example the voltage at a bus for several fault locations.
- Combine tools. Plot a TSAT result next to a PSS/E or PSCAD result, or next to measurements in CSV.
- Find renewable device signals. Device-signal names include the device category, signal, first bus and from bus, so signals with the same name stay distinguishable. Files that contain both
Renewable-ElectricalandRenewable-Plantsignals expose every category. - Measure intervals with Interval Cursors and export the chart as PNG, JPG or SVG.
Plot SSAT eigenvalues
When an SSAT .bin contains eigenvalues, ESPlotter opens one eigenvalue channel for each available scenario and contingency. Add them to an Eigenvalues chart, or add one to a new empty chart and it switches to the Eigenvalues type automatically.
Each eigenvalue is drawn as a point with:
- the real part on the X axis, and
- the imaginary part on the Y axis.
Select a pole to see its details. Depending on what the file provides and what you enable in preferences, the tooltip shows:
- real part,
- imaginary part,
- damping,
- frequency, and
- dominant state.
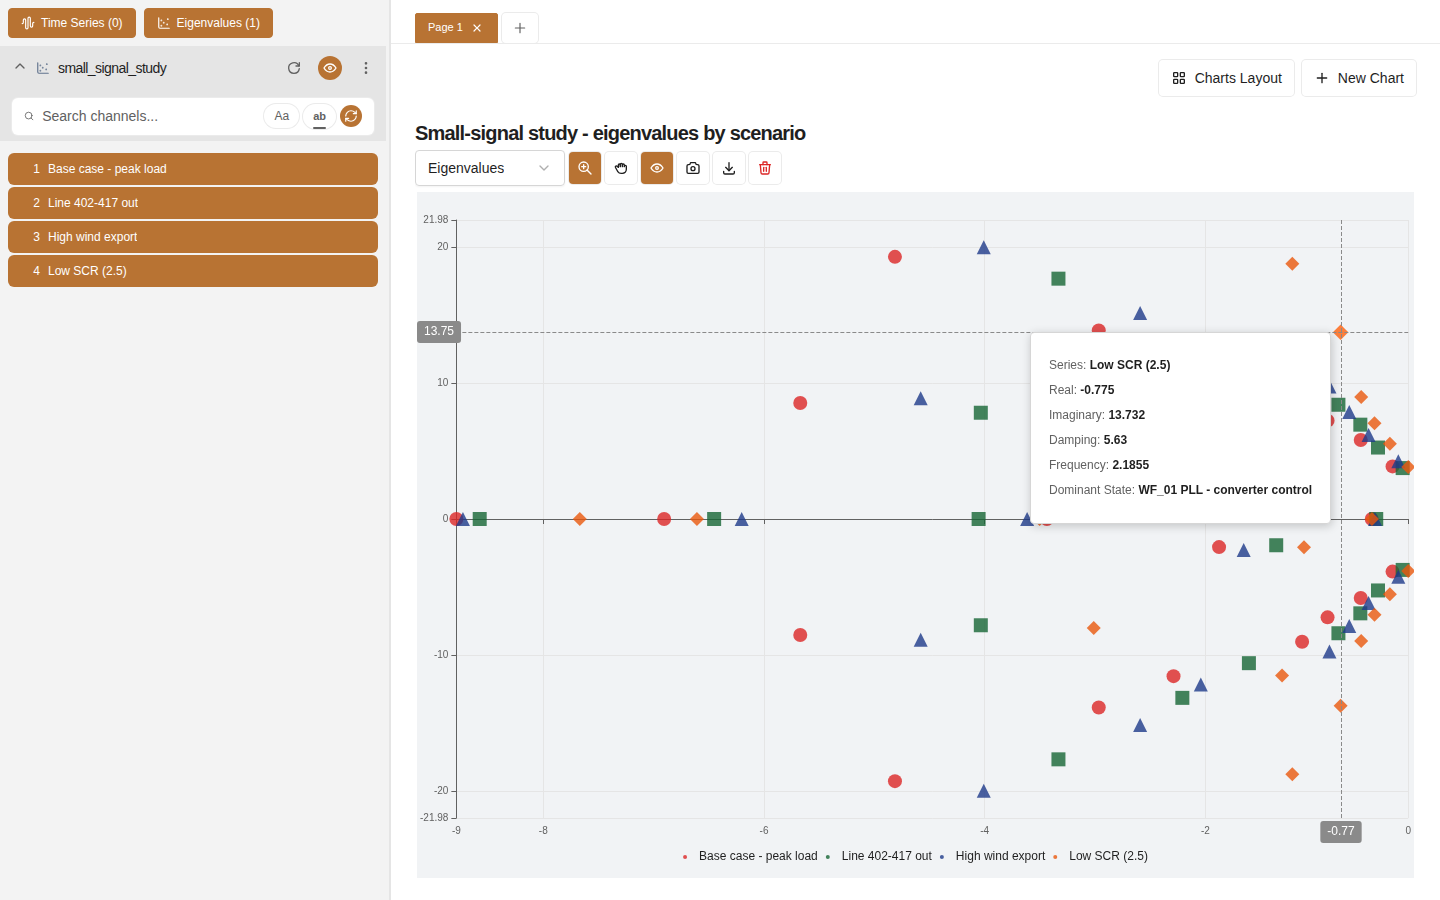
To compare scenarios, give each eigenvalue series its own point color, shape and size, or configure a default palette so every study uses the same visual convention.
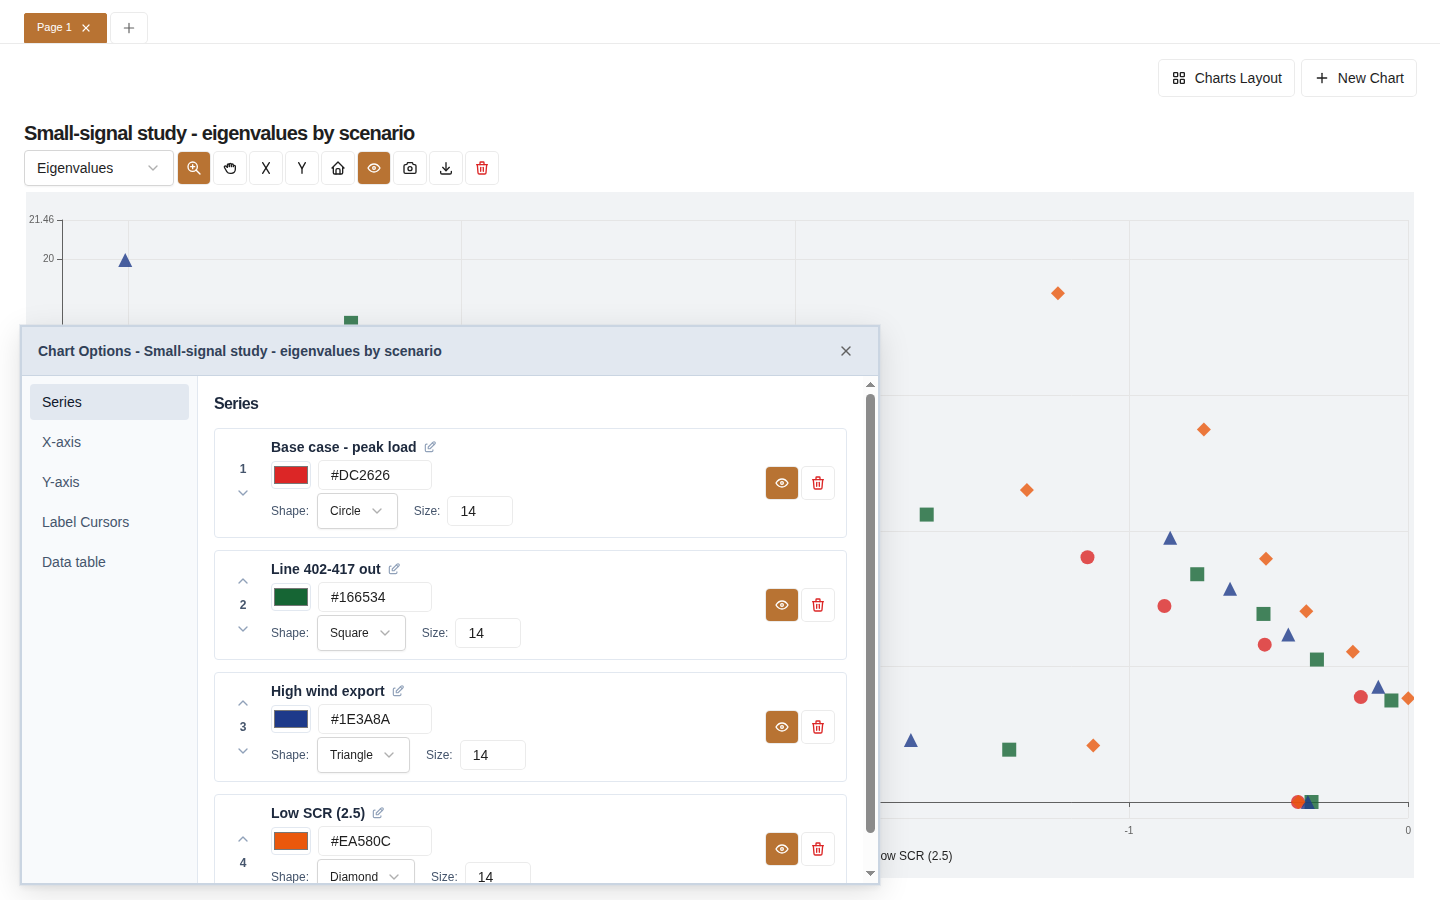
Reading the plot
Eigenvalues with a positive real part indicate unstable modes. Poorly damped modes appear close to the imaginary axis. Plotting several contingencies on one chart makes it easier to see how a mode moves between operating conditions, which is often more informative than reading a table of values.
Export the results
- Time-series results export to CSV, TXT or JSON from the channel sidebar.
- Eigenvalue results export to JSON. The file menu does not offer CSV or TXT for eigenvalue files, because those formats cannot preserve the eigenvalue structure.
JSON exports are indented so they are easy to inspect and compare, and they can be opened again in ESPlotter on a computer without TSAT or SSAT installed. That makes them a practical way to share results with colleagues who do not have DSATools licenses.
Try it with your studies
ESPlotter is free to download during the beta.
Download ESPlotter for Windows
For the exact requirements of each format, see Supported File Formats in the ESPlotter documentation.