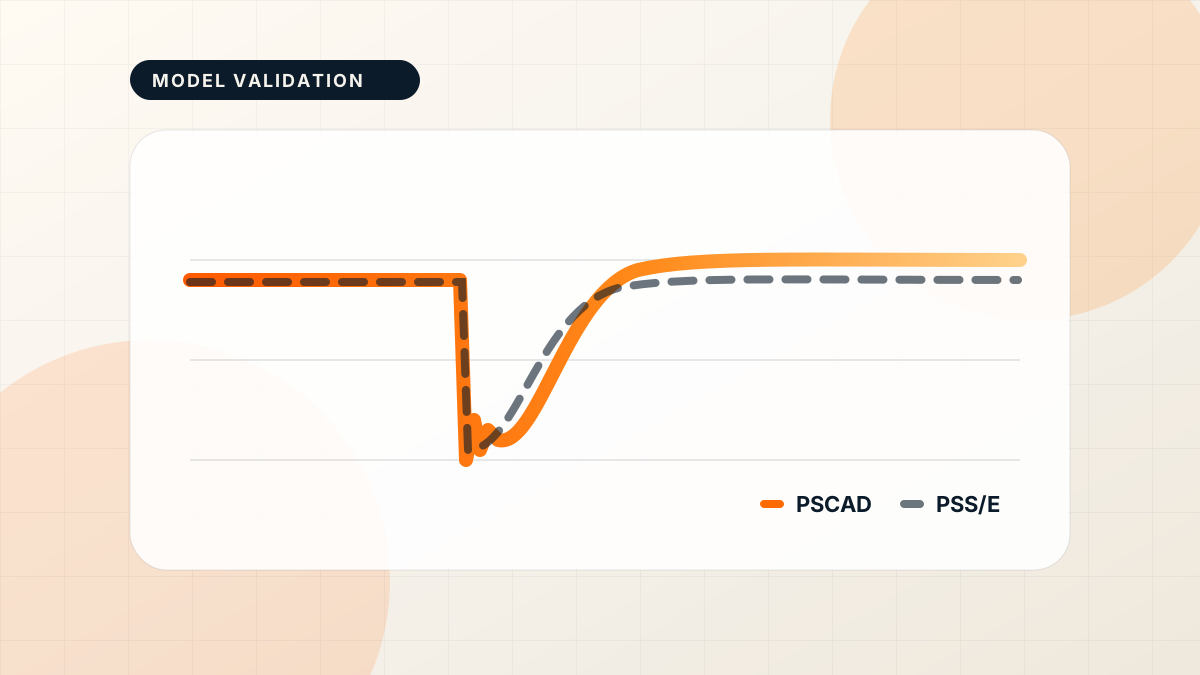
PSCAD / PSS/E / Model Validation
How to Compare PSCAD and PSS/E Simulation Results on One Plot

Javi Rosa
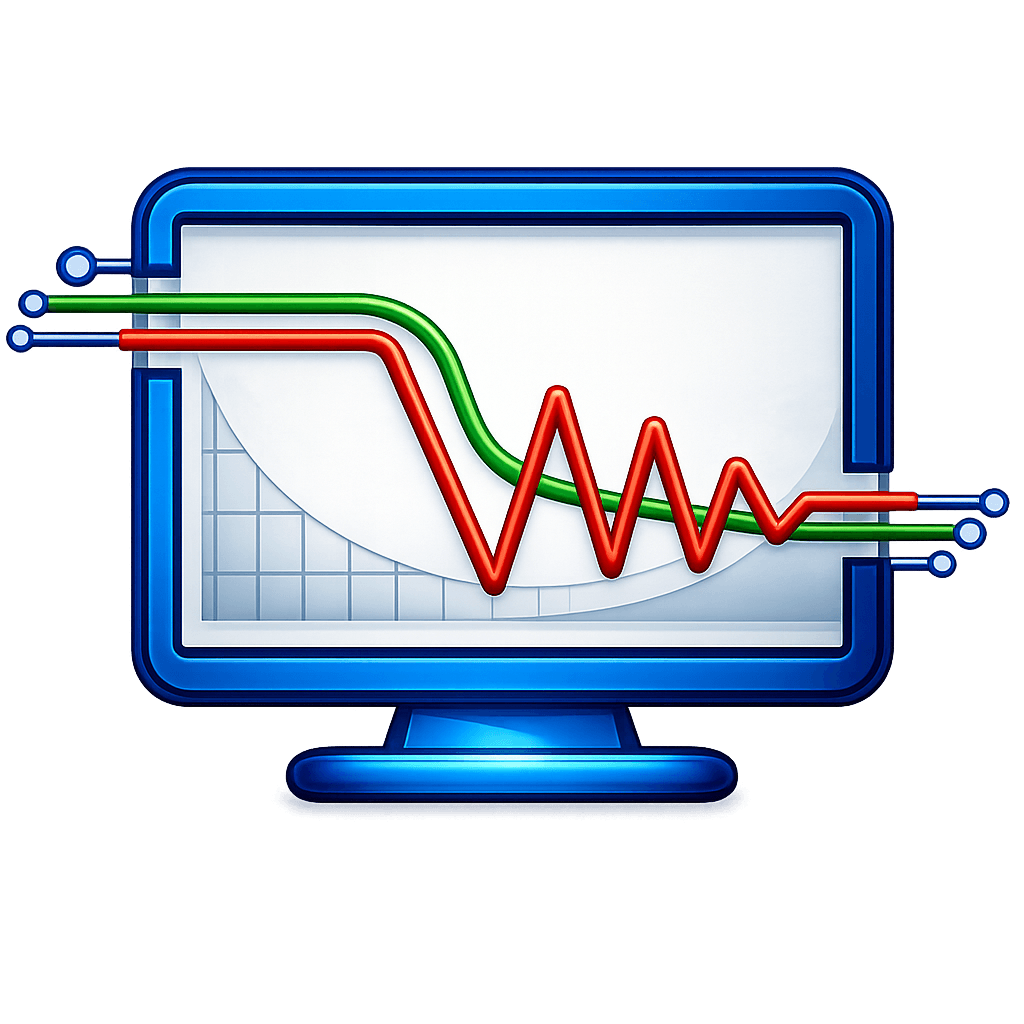
Comparing PSCAD and PSS/E results is part of everyday work in grid integration and model validation. An EMT model in PSCAD and an RMS model in PSS/E describe the same plant, and power system engineers have to show that both respond in a consistent way to the same events: faults, voltage and frequency steps, setpoint changes.
The engineering judgment is in deciding whether the responses match well enough. The tedious part is getting both results onto the same plot. This guide focuses on that second part.
Why the comparison is harder than it looks
The two tools produce very different outputs:
- Different file formats. PSCAD writes an
.inffile with channel descriptions plus numbered text.outfiles with the samples. PSS/E writes a binary.outchannel file that is read through dyntools. - Different time axes. EMT simulations usually need an initialization period, so the disturbance often happens at a different simulation time than in the PSS/E run.
- Different sample rates. PSCAD studies often use microsecond-scale time steps, while PSS/E dynamic runs commonly use millisecond-scale steps. PSCAD therefore records many more samples per second than PSS/E.
- Different modeled dynamics. PSS/E’s RMS model does not resolve electromagnetic transients. During a short circuit, a capacitor can discharge within one simulation step, so voltage may jump from its pre-fault value to its fault value at essentially the same event time. The plotted voltage then has an effectively infinite gradient. PSCAD resolves the electromagnetic transient over time, so its voltage transition has a finite shape and may include overshoot or ringing.
- Different units and bases. One model may report a signal in per unit and the other in physical units, or on a different base.
- Different channel names. The same signal rarely has the same name in both tools.
The classic solution is a script that reads both formats, shifts and scales the signals and plots them together. It works, but it has to be adapted for every project, every channel naming convention, and every new set of cases.
The workflow in ESPlotter
ESPlotter opens both formats in the same workspace, so the comparison becomes a set of interactive steps instead of code.
1. Open the PSCAD results
Use File > Open File and select the PSCAD .inf file. ESPlotter reads the numbered .out files beside it (<name>_01.out, <name>_02.out, …) and opens them as one channel file. Channel names use the Group/Desc structure from the .inf file, such as Main/P_POC.
If some numbered outputs are missing, ESPlotter still opens the channels it can find and shows one warning that lists the missing files.
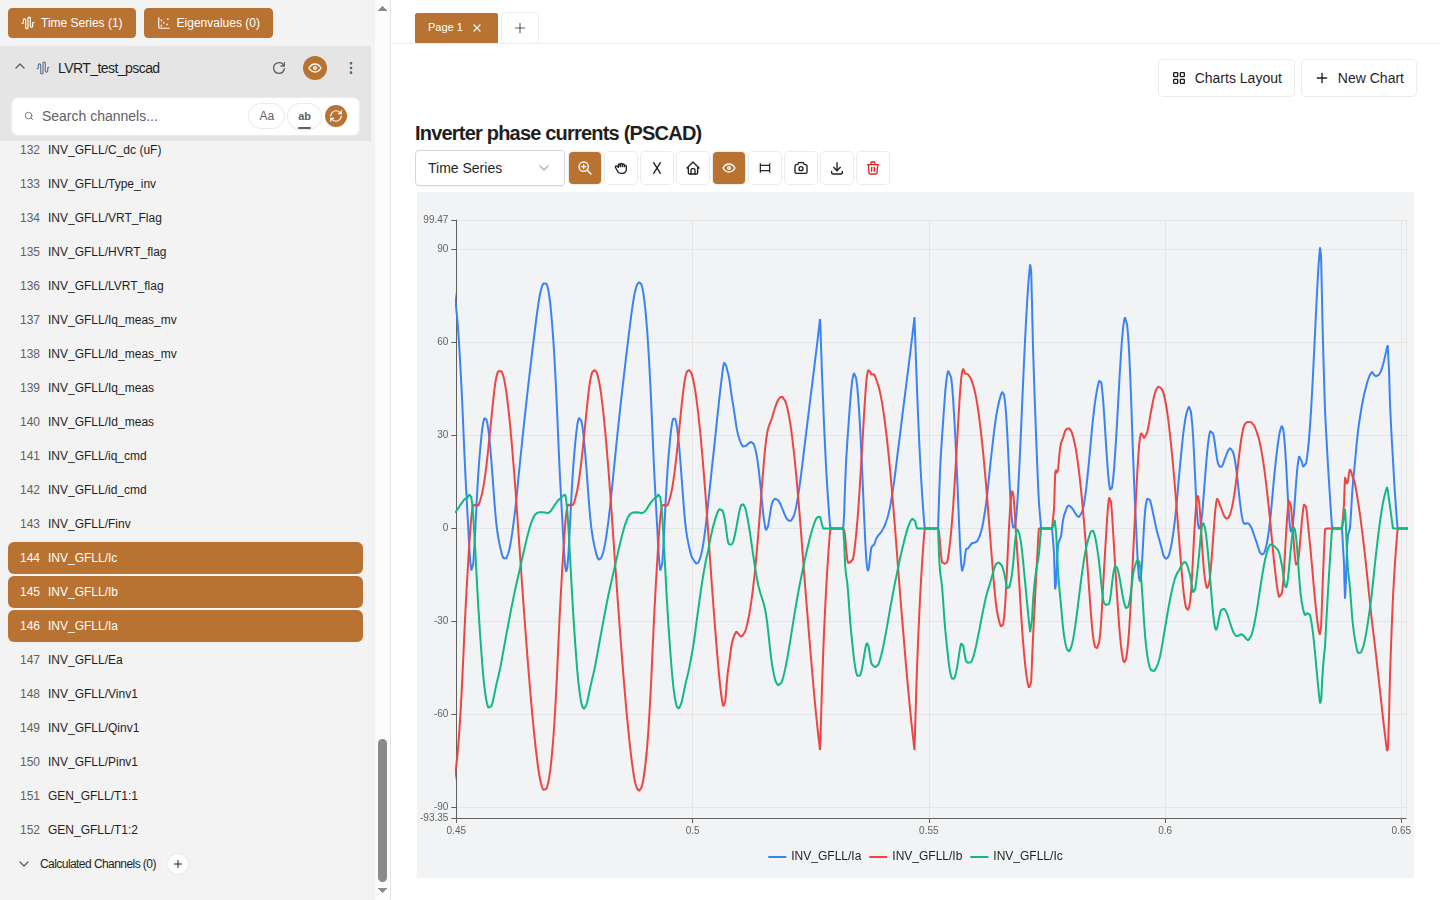
2. Open the PSS/E results
PSS/E .out files are read through your local PSS/E installation. Set PSSE Python path and PSSE Dyntools path once in Settings > General, then open the .out file the same way. See How to Read PSS/E .out Files for details.
You can open several files at once, for example every case of a validation test set.
3. Put the matching signals on one chart
Search each file for the signal you want to compare, such as active power at the point of interconnection, and add both channels to the same Time Series chart. Use color to distinguish the tools, for example, show PSCAD in red and PSS/E in blue.
4. Align the time axes
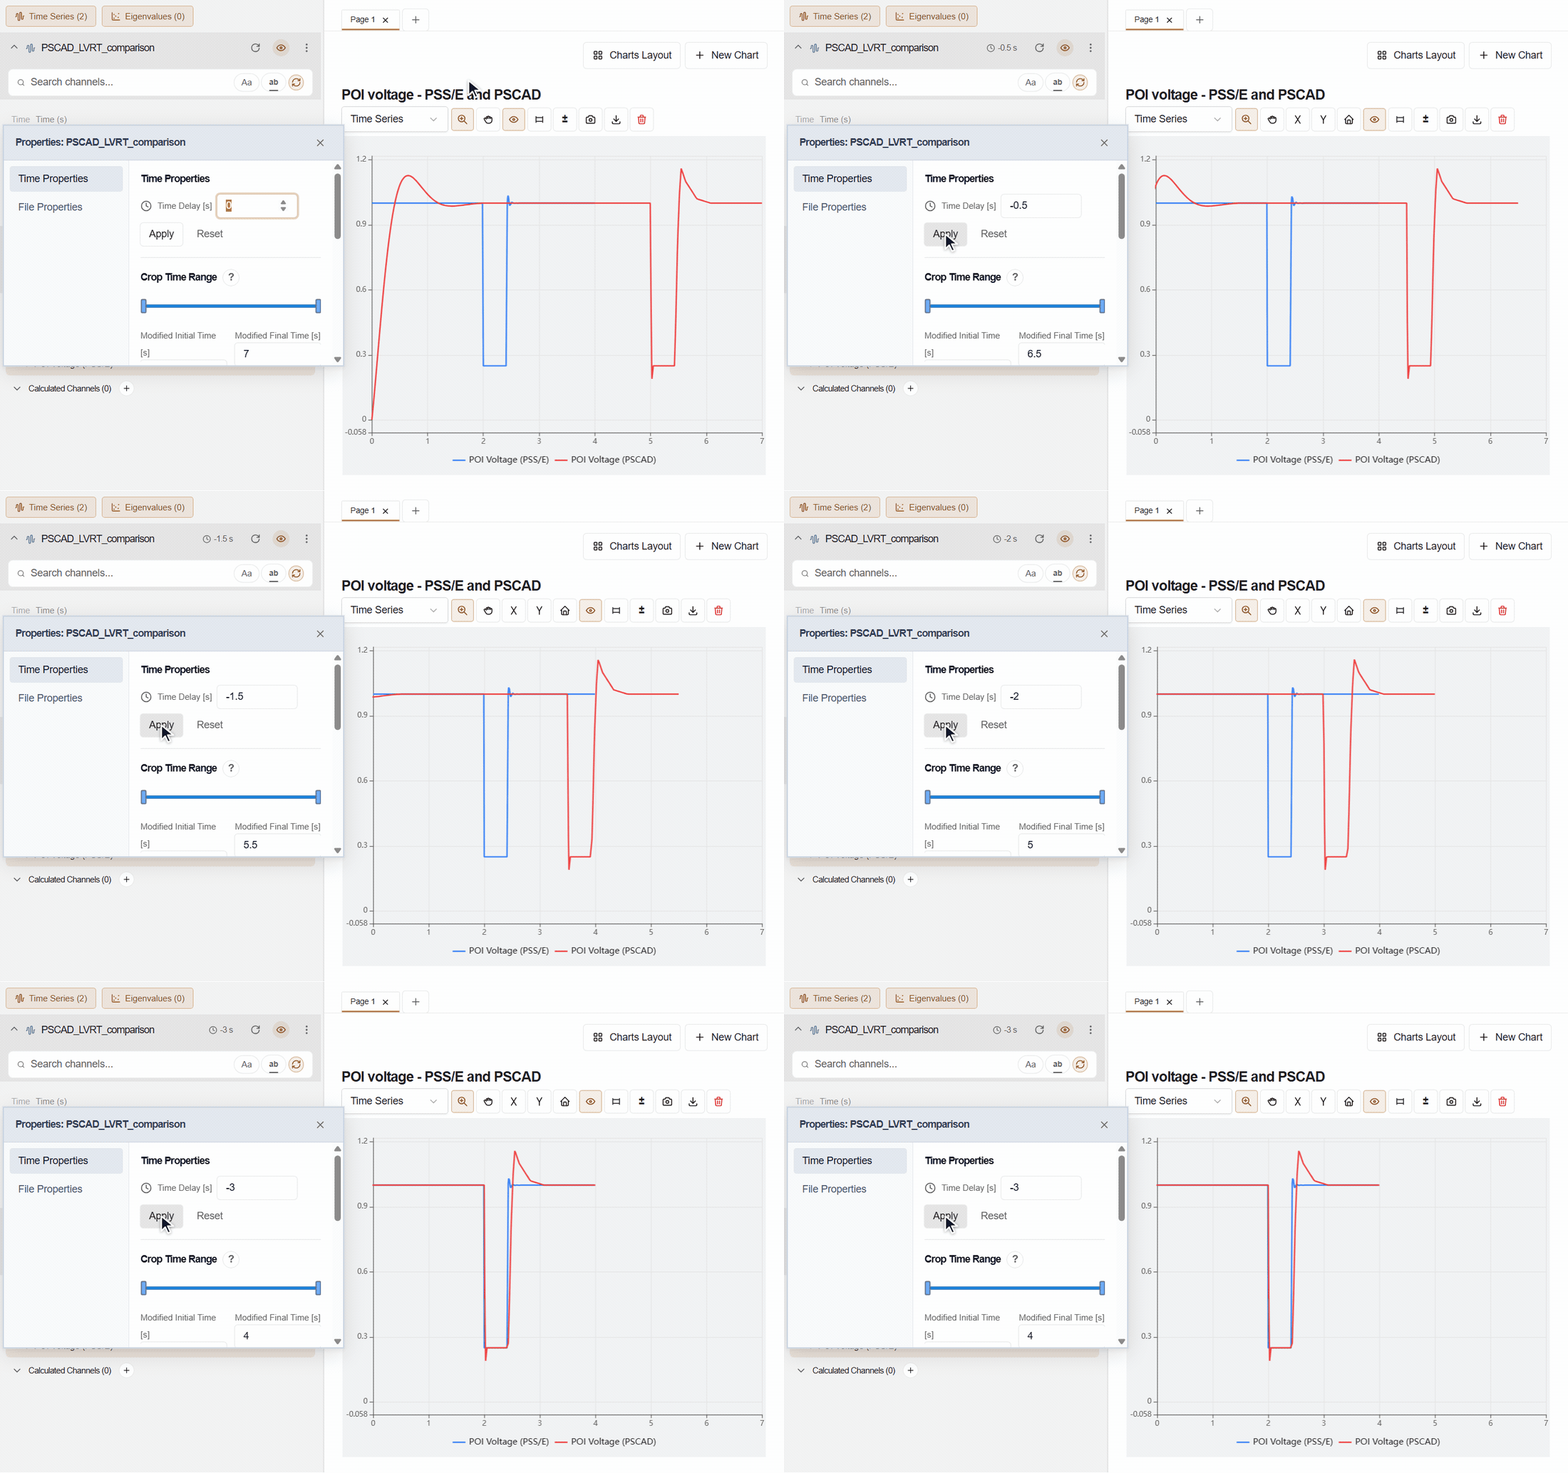
In this example, the PSS/E fault starts at 2.00 s and clears at 2.43 s, while the PSCAD fault starts at 5.00 s. Apply a −3 s time delay to the PSCAD file to align both voltage dips at 2.00 s. The delay shifts every channel from that file, on every chart page, so you align the whole result once instead of channel by channel. The original file on disk is not modified.
The PSS/E voltage trace drops and recovers almost instantaneously at its millisecond-scale time step, with a brief, small recovery overshoot. The PSCAD trace starts from zero during initialization, settles near 1 pu by 2 s, then shows a rounded fault transition and a slower recovery with a larger overshoot. The two models can therefore show different voltage dynamics even after their event times are aligned.
5. Match units and scale
Use gain and offset on a channel to bring both signals to the same units or base. When the scales are still different, assign one series to the right Y axis so both responses remain readable.
For EMT signals with high-frequency content that is not relevant to the comparison, a channel low-pass filter can help you focus on the response you are validating. Use it consciously and document it, because filtering changes what you are comparing.
6. Measure, not just look
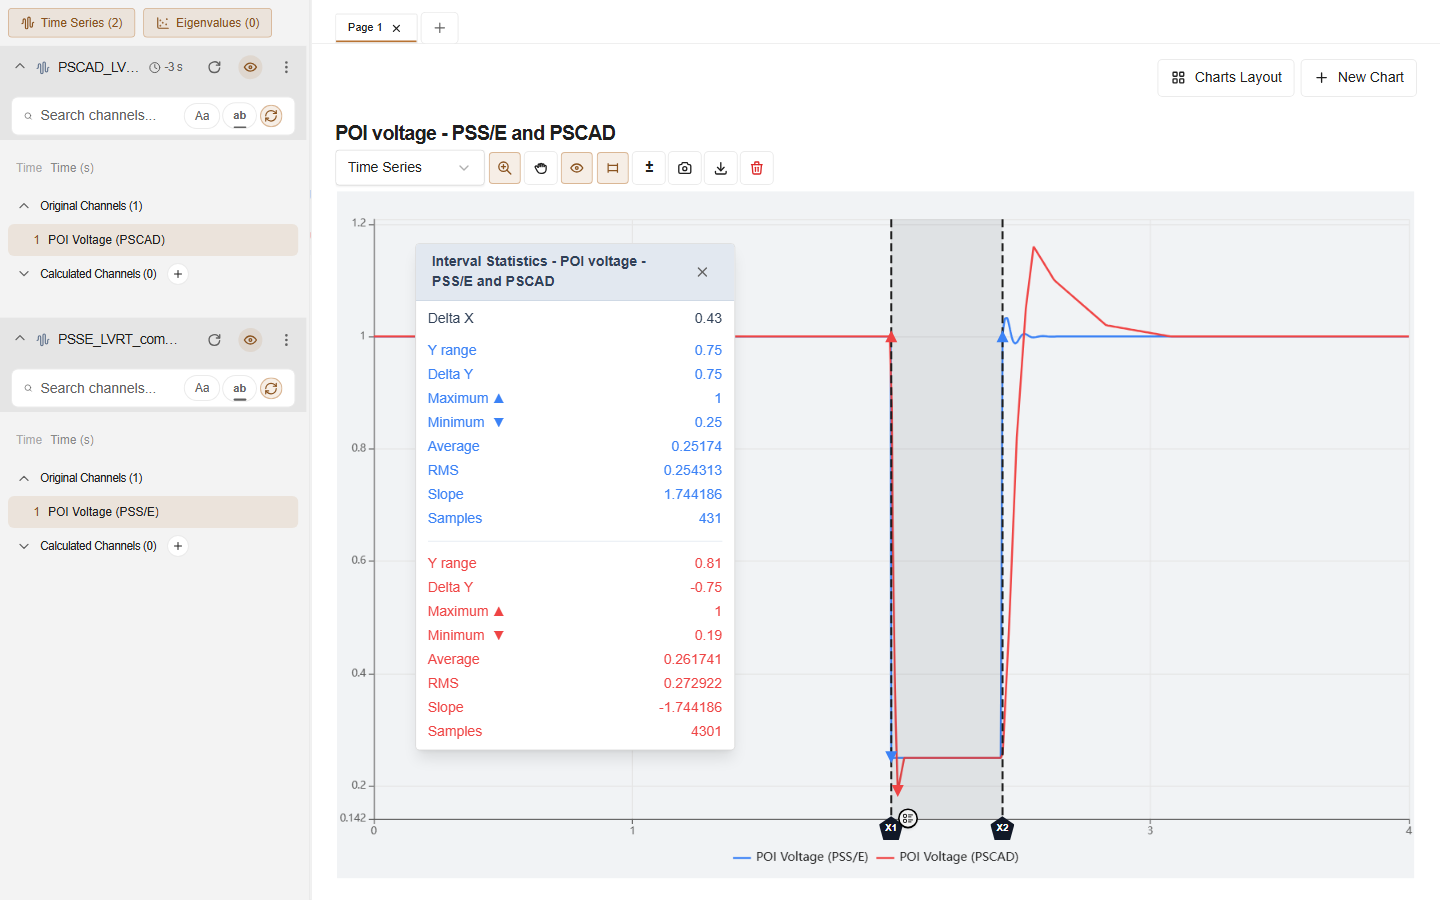
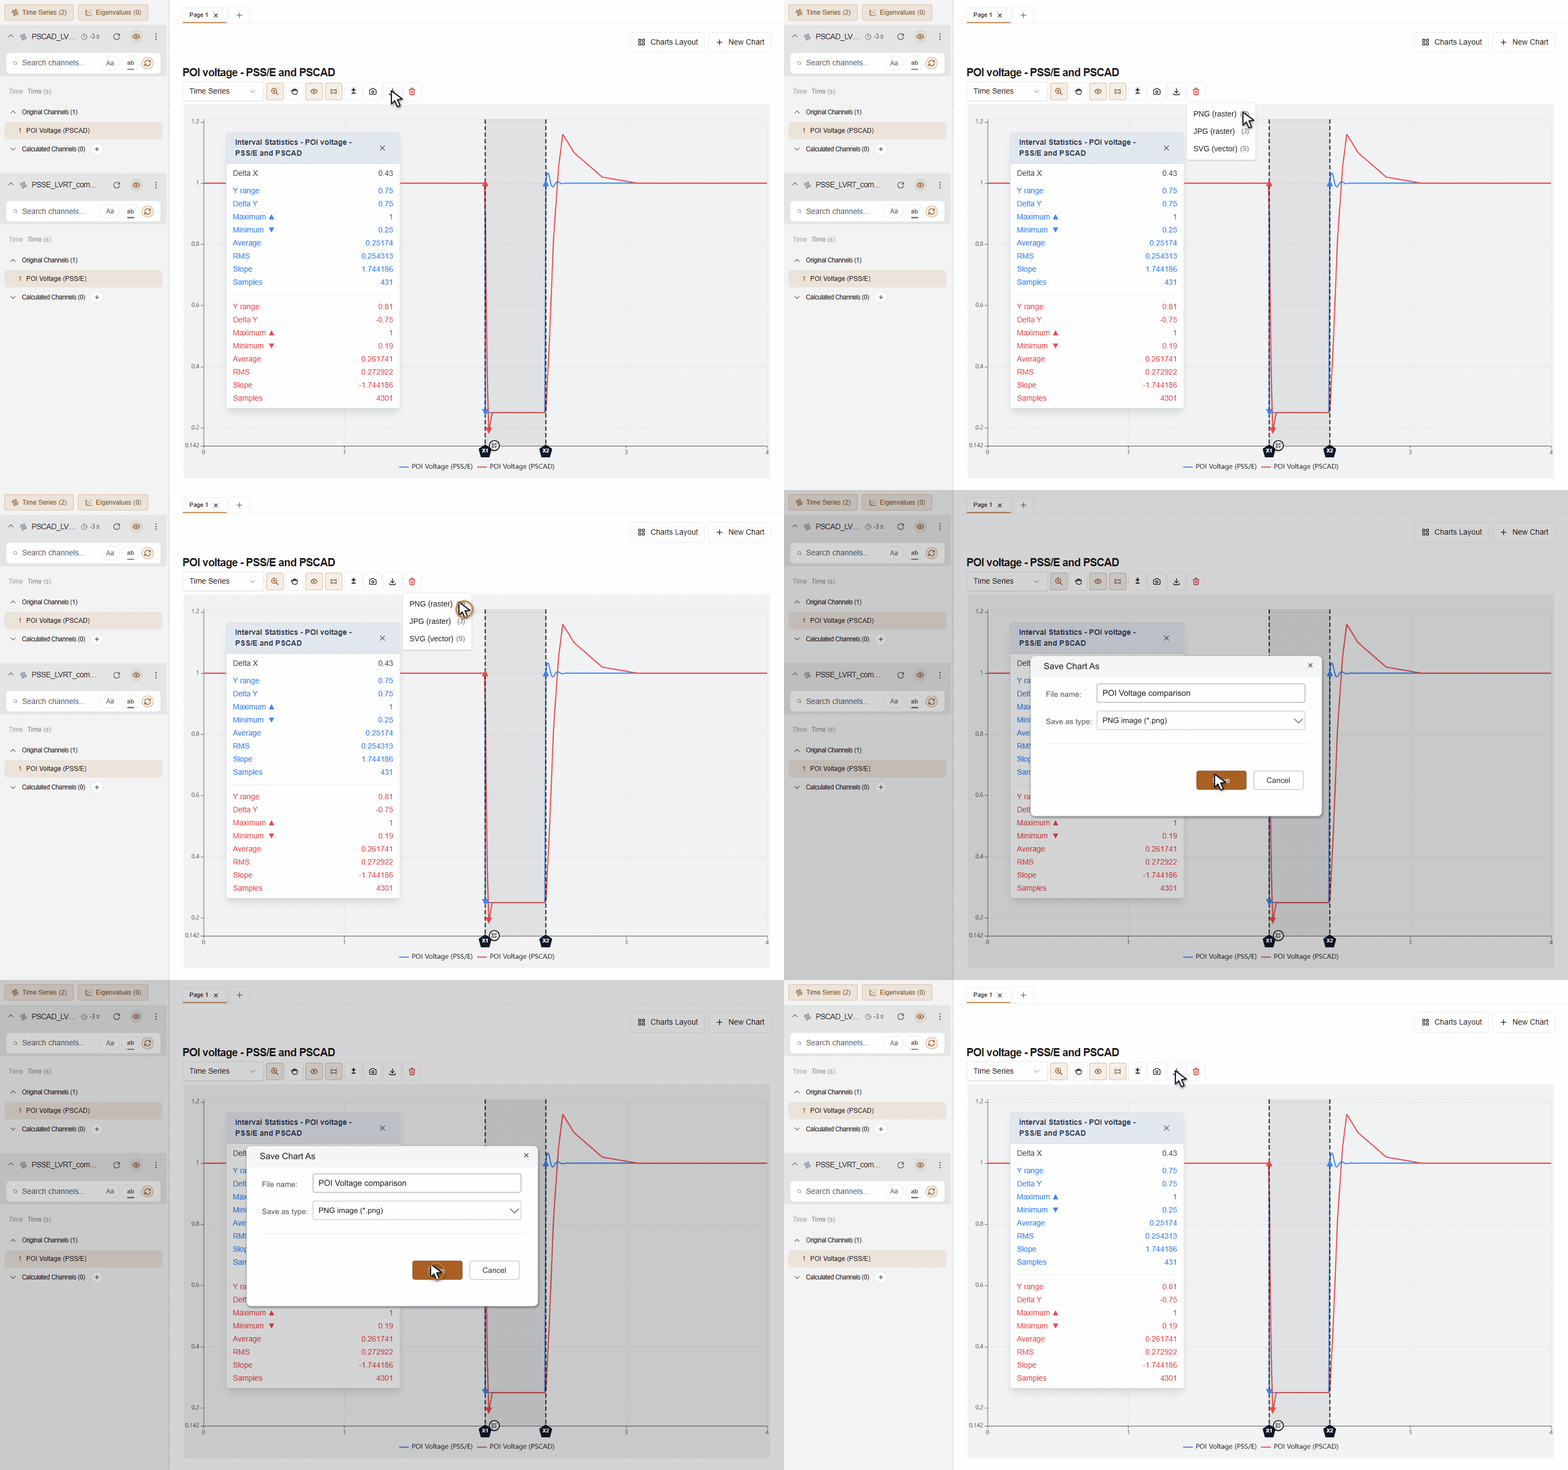
Overlaying two curves shows whether they look similar. Validation reports often need numbers. Interval Cursors place two X boundaries on the chart and show statistics for each selected channel between them: Delta X, Y range, Delta Y, minimum, maximum, average, RMS, slope and sample count. Here, the cursors bracket the aligned 430 ms fault, and the overlay reports statistics for the POI voltage channel from each tool. Use them to compare settling values, peaks or ramp rates between both tools.
7. Export for the report
Choose PNG (raster), name the file POI Voltage comparison, and save the chart for the report.
If you need the aligned data in another tool, export each channel file to CSV, TXT or JSON from the sidebar. Exports include the time delay, gain, offset, filters and renamed labels you applied, so the exported data matches what you see on screen.
Tips for repeatable comparisons
- Rename channels to a shared convention so the legend reads the same across every case.
- Use multi-chart pages to show voltage, active power and reactive power for one case on one page.
- Keep one page per test case, so the workspace mirrors the structure of the validation report.
- Restore your workspace. ESPlotter can restore the previous session on startup, so you can continue a comparison without opening every file again.
Try it on your next validation case
ESPlotter is free to download during the beta. Open one PSCAD case and its PSS/E counterpart and see how long it takes to get both responses on one chart.