PSS/E / Tutorial / CSV
How to Convert PSS/E .out Files to CSV

Javi Rosa
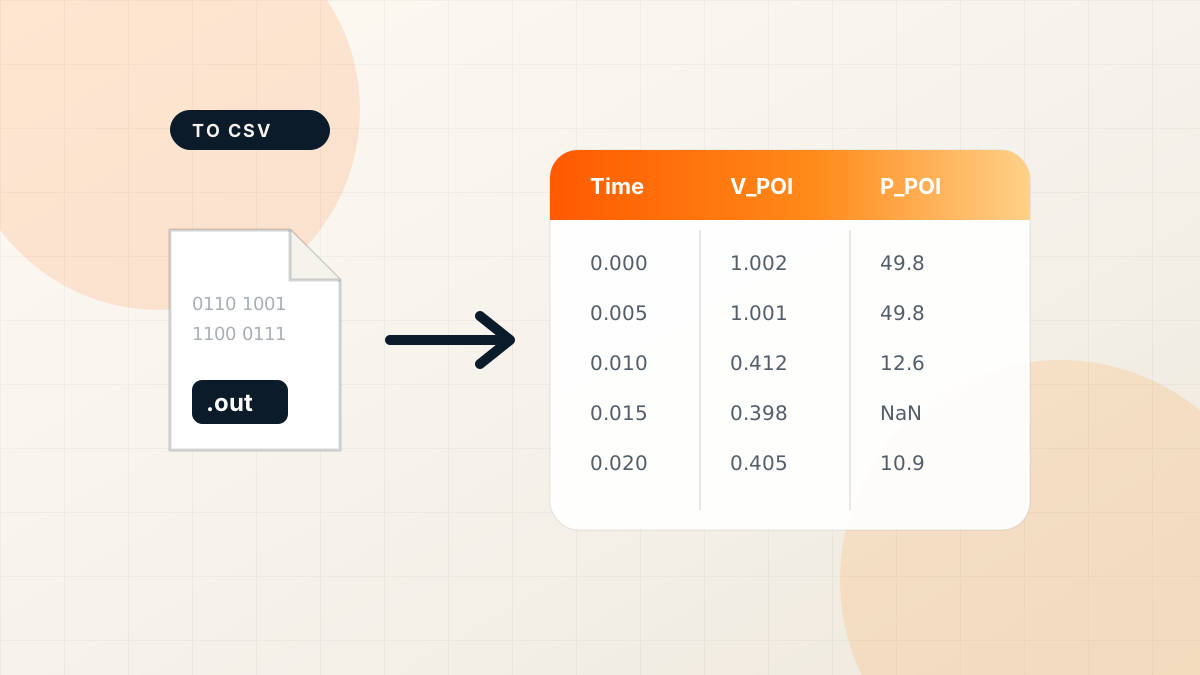
PSS/E stores dynamic simulation results in binary .out files. That works well inside PSS/E, but sooner or later someone needs the data somewhere else: a spreadsheet, MATLAB, a Python notebook, a customer who does not have PSS/E, or a comparison against PSCAD or field measurements.
The usual answer is to convert the .out file to CSV. This guide shows two ways to do it and the details that tend to cause trouble.
Both options need PSS/E installed on the Windows computer that performs the conversion, because .out files are read through PSS/E’s dyntools. Once converted, the CSV can be opened anywhere.
Option 1: dyntools csvout
dyntools, the post-processing module that ships with PSS/E, includes a csvout method on its CHNF class:
import sys

# Adjust to your PSS/E installation and use the Python version it supports
sys.path.append(r"C:\Program Files\PTI\PSSE36\36.3\PSSPY313")
import dyntools

chnf = dyntools.CHNF(r"C:\studies\three_phase_fault.out")
chnf.csvout(csvfile=r"C:\studies\three_phase_fault.csv")
By default, every channel in the file is written. To export only some of them, inspect the channel numbers first and pass them in the channels argument:
short_title, chan_ids, chan_data = chnf.get_data()
for key, name in chan_ids.items():
    print(key, name)

chnf.csvout(channels=[1, 5, 12], csvfile=r"C:\studies\selected_channels.csv")
Argument names can change between PSS/E releases, so check the dyntools documentation for your version if a call fails.
Writing your own CSV
If you need full control over headers or number formatting, read the data with get_data() and write the file yourself:
import csv

short_title, chan_ids, chan_data = chnf.get_data()
channels = [key for key in chan_ids if key != "time"]

with open(r"C:\studies\custom.csv", "w", newline="") as handle:
    writer = csv.writer(handle)
    writer.writerow(["Time"] + [chan_ids[key] for key in channels])
    for index, time in enumerate(chan_data["time"]):
        writer.writerow([time] + [chan_data[key][index] for key in channels])
This approach is useful in automated pipelines. It becomes tedious when every study needs a different channel selection, units, or time alignment.
Option 2: Export from ESPlotter
ESPlotter reads .out files through your PSS/E installation and lets you export them from the channel sidebar.
- In Settings > General, set PSSE Python path and PSSE Dyntools path to the matching paths of your PSS/E installation. You only do this once.
- Open the
.outfile with File > Open File, or drag it into the chart workspace. - Right-click the file in the sidebar, or use its three-dot menu, and choose the CSV export.
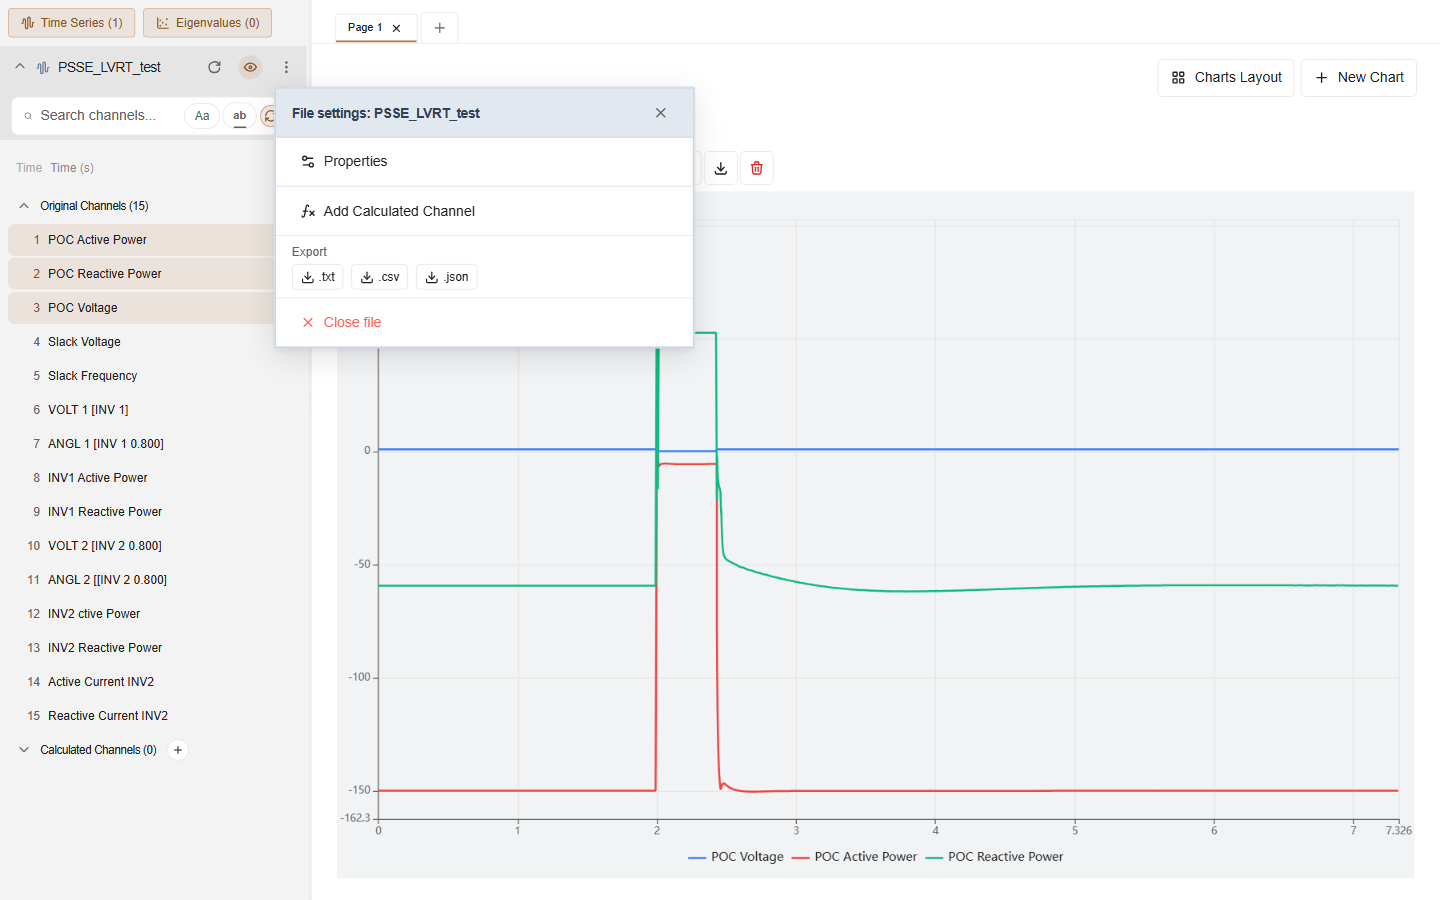
A few details make this export useful beyond a plain conversion:
- Adjustments are included. Time delay, gain, offset, low-pass filters, renamed labels and calculated channels are written to the export. If you shifted the time axis to align an event or converted units with a gain, the CSV contains that result.
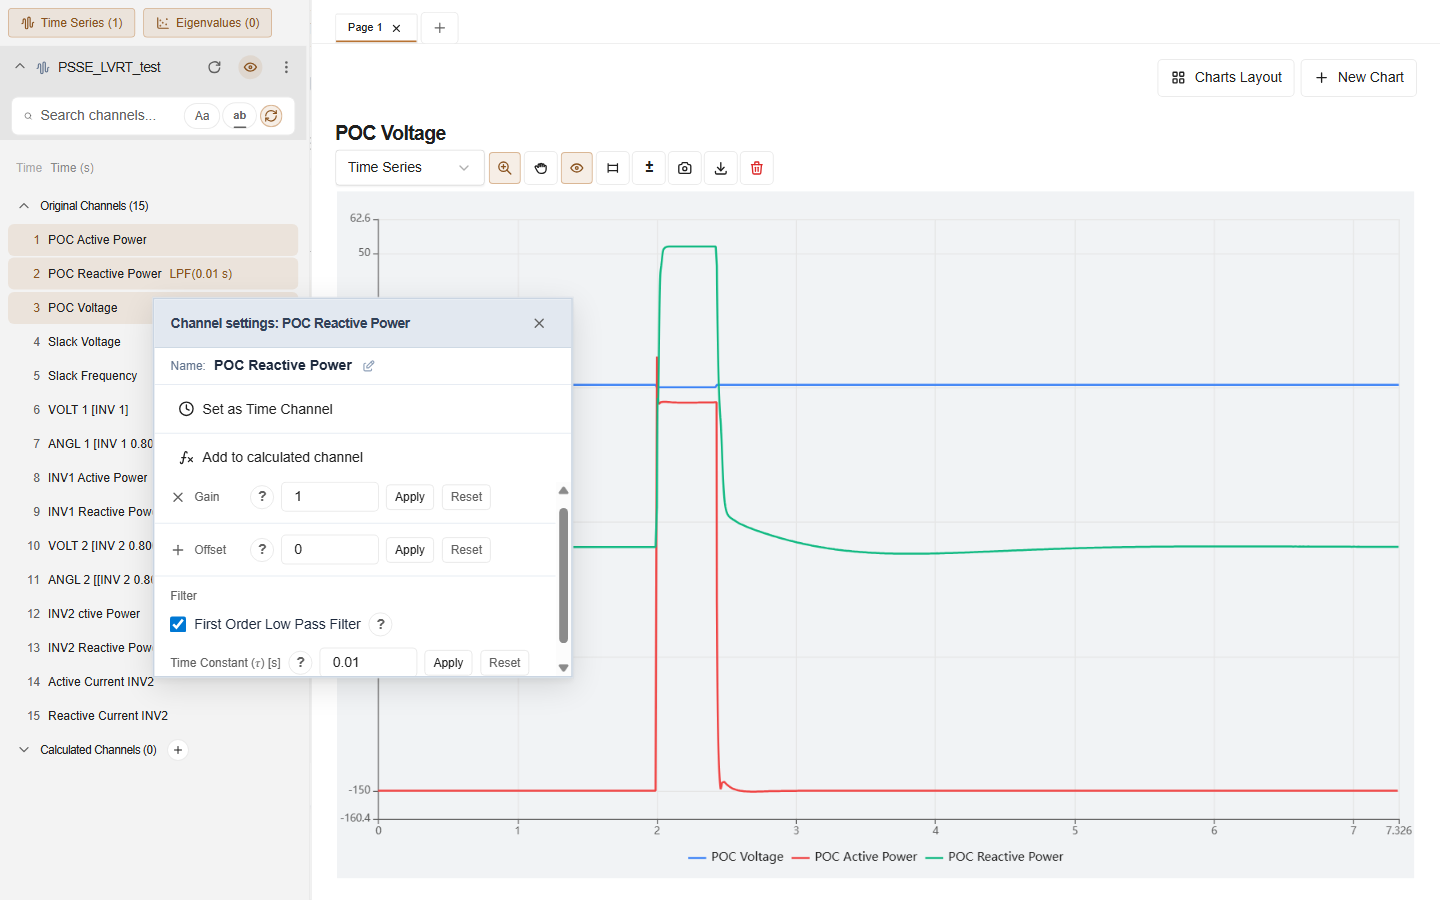
- Choose CSV, TXT or JSON. The same menu exports to any of the three formats.
NaNvalues are preserved. Samples that PSS/E wrote as invalid values are exported as literalNaNcells in the same position, so you do not lose track of where the simulation had problems.- Labels stay intact. Channel names that contain commas or quotes are escaped correctly, and ESPlotter restores the original label if you import the CSV again.
Before exporting, you can plot the channels to check that you are exporting the right case and the right signals.
Things to check after converting
File size is different from the original. That is expected. A CSV is text, and ESPlotter writes normalized numeric values instead of reproducing the source file’s spacing or padding. The channels, row order and sample values are what matter.
Time step. Dynamic simulations may not use a constant step across the whole run. Check the time column before assuming a fixed sample rate in another tool.
Opening in Excel. Very long simulations can produce many rows. Excel works well for small exports; for large ones, a plotting tool or a script is usually more practical.
Convert your first file
ESPlotter is free to download during the beta.
Download ESPlotter for Windows
New to PSS/E output files? Start with How to Read PSS/E .out Files.