data
What Real-World Data Taught Us About User Experience
%22%2F%3E%3Ccircle%20cx%3D%2270%22%20cy%3D%2224%22%20r%3D%2222%22%20fill%3D%22%23ffffff%22%20opacity%3D%22.16%22%2F%3E%3Ctext%20x%3D%2248%22%20y%3D%2257%22%20text-anchor%3D%22middle%22%20font-family%3D%22Inter%2C%20Arial%2C%20sans-serif%22%20font-size%3D%2230%22%20font-weight%3D%22700%22%20fill%3D%22%23fff%22%3EET%3C%2Ftext%3E%3C%2Fsvg%3E)
ESPlotter Team
When we started building ESPlotter, we assumed the problem would be relatively simple: read numerical data and plot it.
Maybe we would occasionally encounter integers, floating-point values, or scientific notation, but overall, we expected the input data to be clean and predictable.
Reality turned out to be very different.
Within the first weeks of development, we discovered our first unexpected challenge: NaN values.
Some of them came from non-convergent PSS/E simulations. Others originated from undeclared variables in our PSCAD models. In both cases, invalid numerical values could silently propagate into the plotting engine and corrupt graphs and calculations.
At that point, we realized something important:
Most software issues are not caused by algorithms, but by assumptions about the input data.
So we implemented validation layers to detect NaN values early and prevent them from affecting the user experience.
Not long after that, another colleague imported data from PPC logs and noticed something else: some channels contained logical values such as True and False.
Again, this was something we had not anticipated.
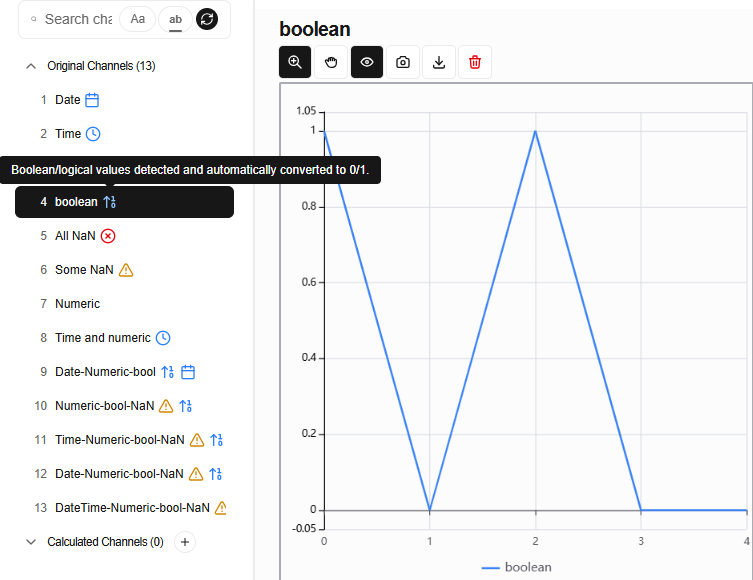
The plotting engine expected numerical inputs, so those boolean values were not handled correctly. We therefore introduced automatic boolean conversion:
| Boolean value | Numeric value |
|---|---|
True | 1 |
False | 0 |
From that point onward, those channels could behave as standard numerical signals inside the software.
Then came another surprise.
Some users started importing real measurement datasets containing timestamps, dates, and mixed time formats. Once again, our original assumptions broke down. The software was never designed to interpret date/time values as plottable numerical channels.
This forced us to rethink both the technical architecture and the user experience of the application.
What We Learned About User Experience
Building ESPlotter taught us several lessons that apply far beyond plotting software.
1. Always Expect the Unexpected
Users will always interact with software in ways that developers did not initially imagine.
Even if your application is designed for a specific workflow, real-world datasets will eventually contain edge cases, mixed formats, incomplete values, or inconsistent conventions.
Defensive software design is not optional. It is essential.
2. Real-World Data Is Messy
Theoretical inputs are clean.
Production data is not.
Simulation outputs, measurement systems, logs, spreadsheets, and manually edited files all introduce inconsistencies that software must be prepared to handle gracefully.
A robust application should not simply fail when encountering unexpected data types. It should:
- Detect the issue.
- Explain it clearly.
- Guide the user toward a valid workflow.
3. Flexibility Matters
As developers, we learned that software architecture must remain adaptable.
Every new data format forced us to reconsider validation rules, internal data handling, export behavior, and calculation logic.
Supporting real-world engineering workflows means continuously evolving alongside the needs of users.
4. Communication With Users Is Critical
Many of the improvements in ESPlotter came directly from user feedback.
Some users worked mainly with simulation outputs. Others imported operational logs. Others processed measurement systems with timestamp channels.
Each workflow introduced new assumptions and new requirements.
That feedback loop became one of the most valuable parts of the development process.
The Technical Decisions We Made
As ESPlotter evolved, we implemented a hierarchy of validation and channel-handling rules.
NaN Values
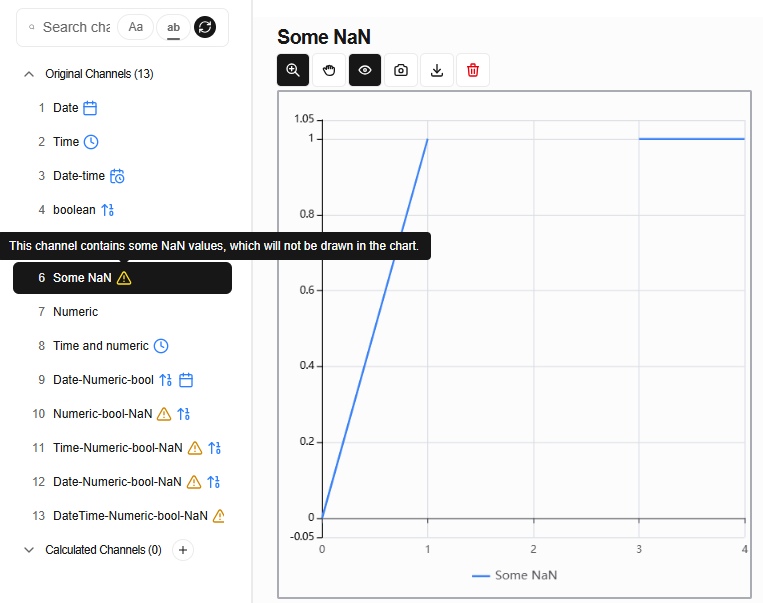
A) Channels containing mixed numerical and NaN values:
- Display a warning icon.
- Can still be plotted based on their numeric values.
- Cannot be used in calculated channels, which prevents error propagation.
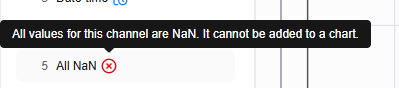
B) Channels whose entries are all NaN values:
- Display an error icon.
- Cannot be plotted because there are no numerical values.
- Raise a dedicated error message when clicked to add them to a chart.
- Cannot be added to calculated channels.
Boolean Values
Boolean channels are automatically converted into numerical representations:
| Source value | Internal value |
|---|---|
True | 1 |
False | 0 |
After conversion, they behave as standard numerical channels and can:
- Be plotted.
- Participate in calculations.
- Be exported normally.
Date and Time Values
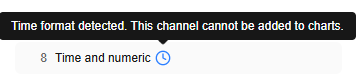
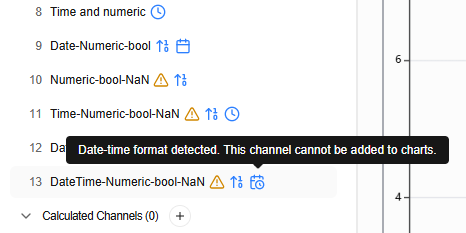
Channels containing date or time information receive dedicated handling.
These channels:
- Display a specific icon.
- Cannot be plotted as numerical signals.
- Cannot participate in calculated channels.
However, they are still preserved during import and export operations. This allows users to:
- Import datasets containing timestamps and measurements.
- Process the valid numerical channels.
- Export the complete dataset while preserving the original time information correctly.
Designing for Edge Cases
One of the most important lessons we learned was that mixed-format channels require consistent prioritization rules.
When multiple data types appear together, ESPlotter applies the most restrictive interpretation for the entire channel.
The current priority hierarchy is:
Date/Time -> NaN -> Boolean -> NumericalThis approach helps prevent ambiguous behavior and improves predictability for the user.
Looking Ahead
This experience completely changed the way we think about data handling.
What initially looked like a simple plotting tool became an exercise in:
- Defensive programming.
- Validation architecture.
- User experience design.
- Real-world interoperability.
Now we would like to hear your feedback.
What unusual data formats have you encountered in your workflows?
Would you expect support for:
- Hexadecimal values?
- Percentages?
- Currency formats?
- Categorical labels?
- Unicode or multilingual text?
- Other engineering-specific conventions?
And more importantly: how would you expect software to handle them?
We are continuously improving ESPlotter to adapt to real engineering workflows, and user feedback plays a major role in shaping that evolution.
If you want to learn more about ESPlotter, you can download the beta version for free from our website.